R is powerful and ggplot2 makes it more accessible.
Recently, I need to create a plot that has the Greek letter \(\mu\) displayed as a label.
First I tried the following script in terminal
r <- rnorm(mean = 5, sd = 1, n = 1000)
df <- data.frame(r)
h <- ggplot(df,aes(r))
h <- h + geom_histogram()
lstr1 <- expression(mu == 5)
h <- h + annotate(geom="text",label=as.character(lstr1),x=8,y=100,family="Times",size=6,parse=TRUE)
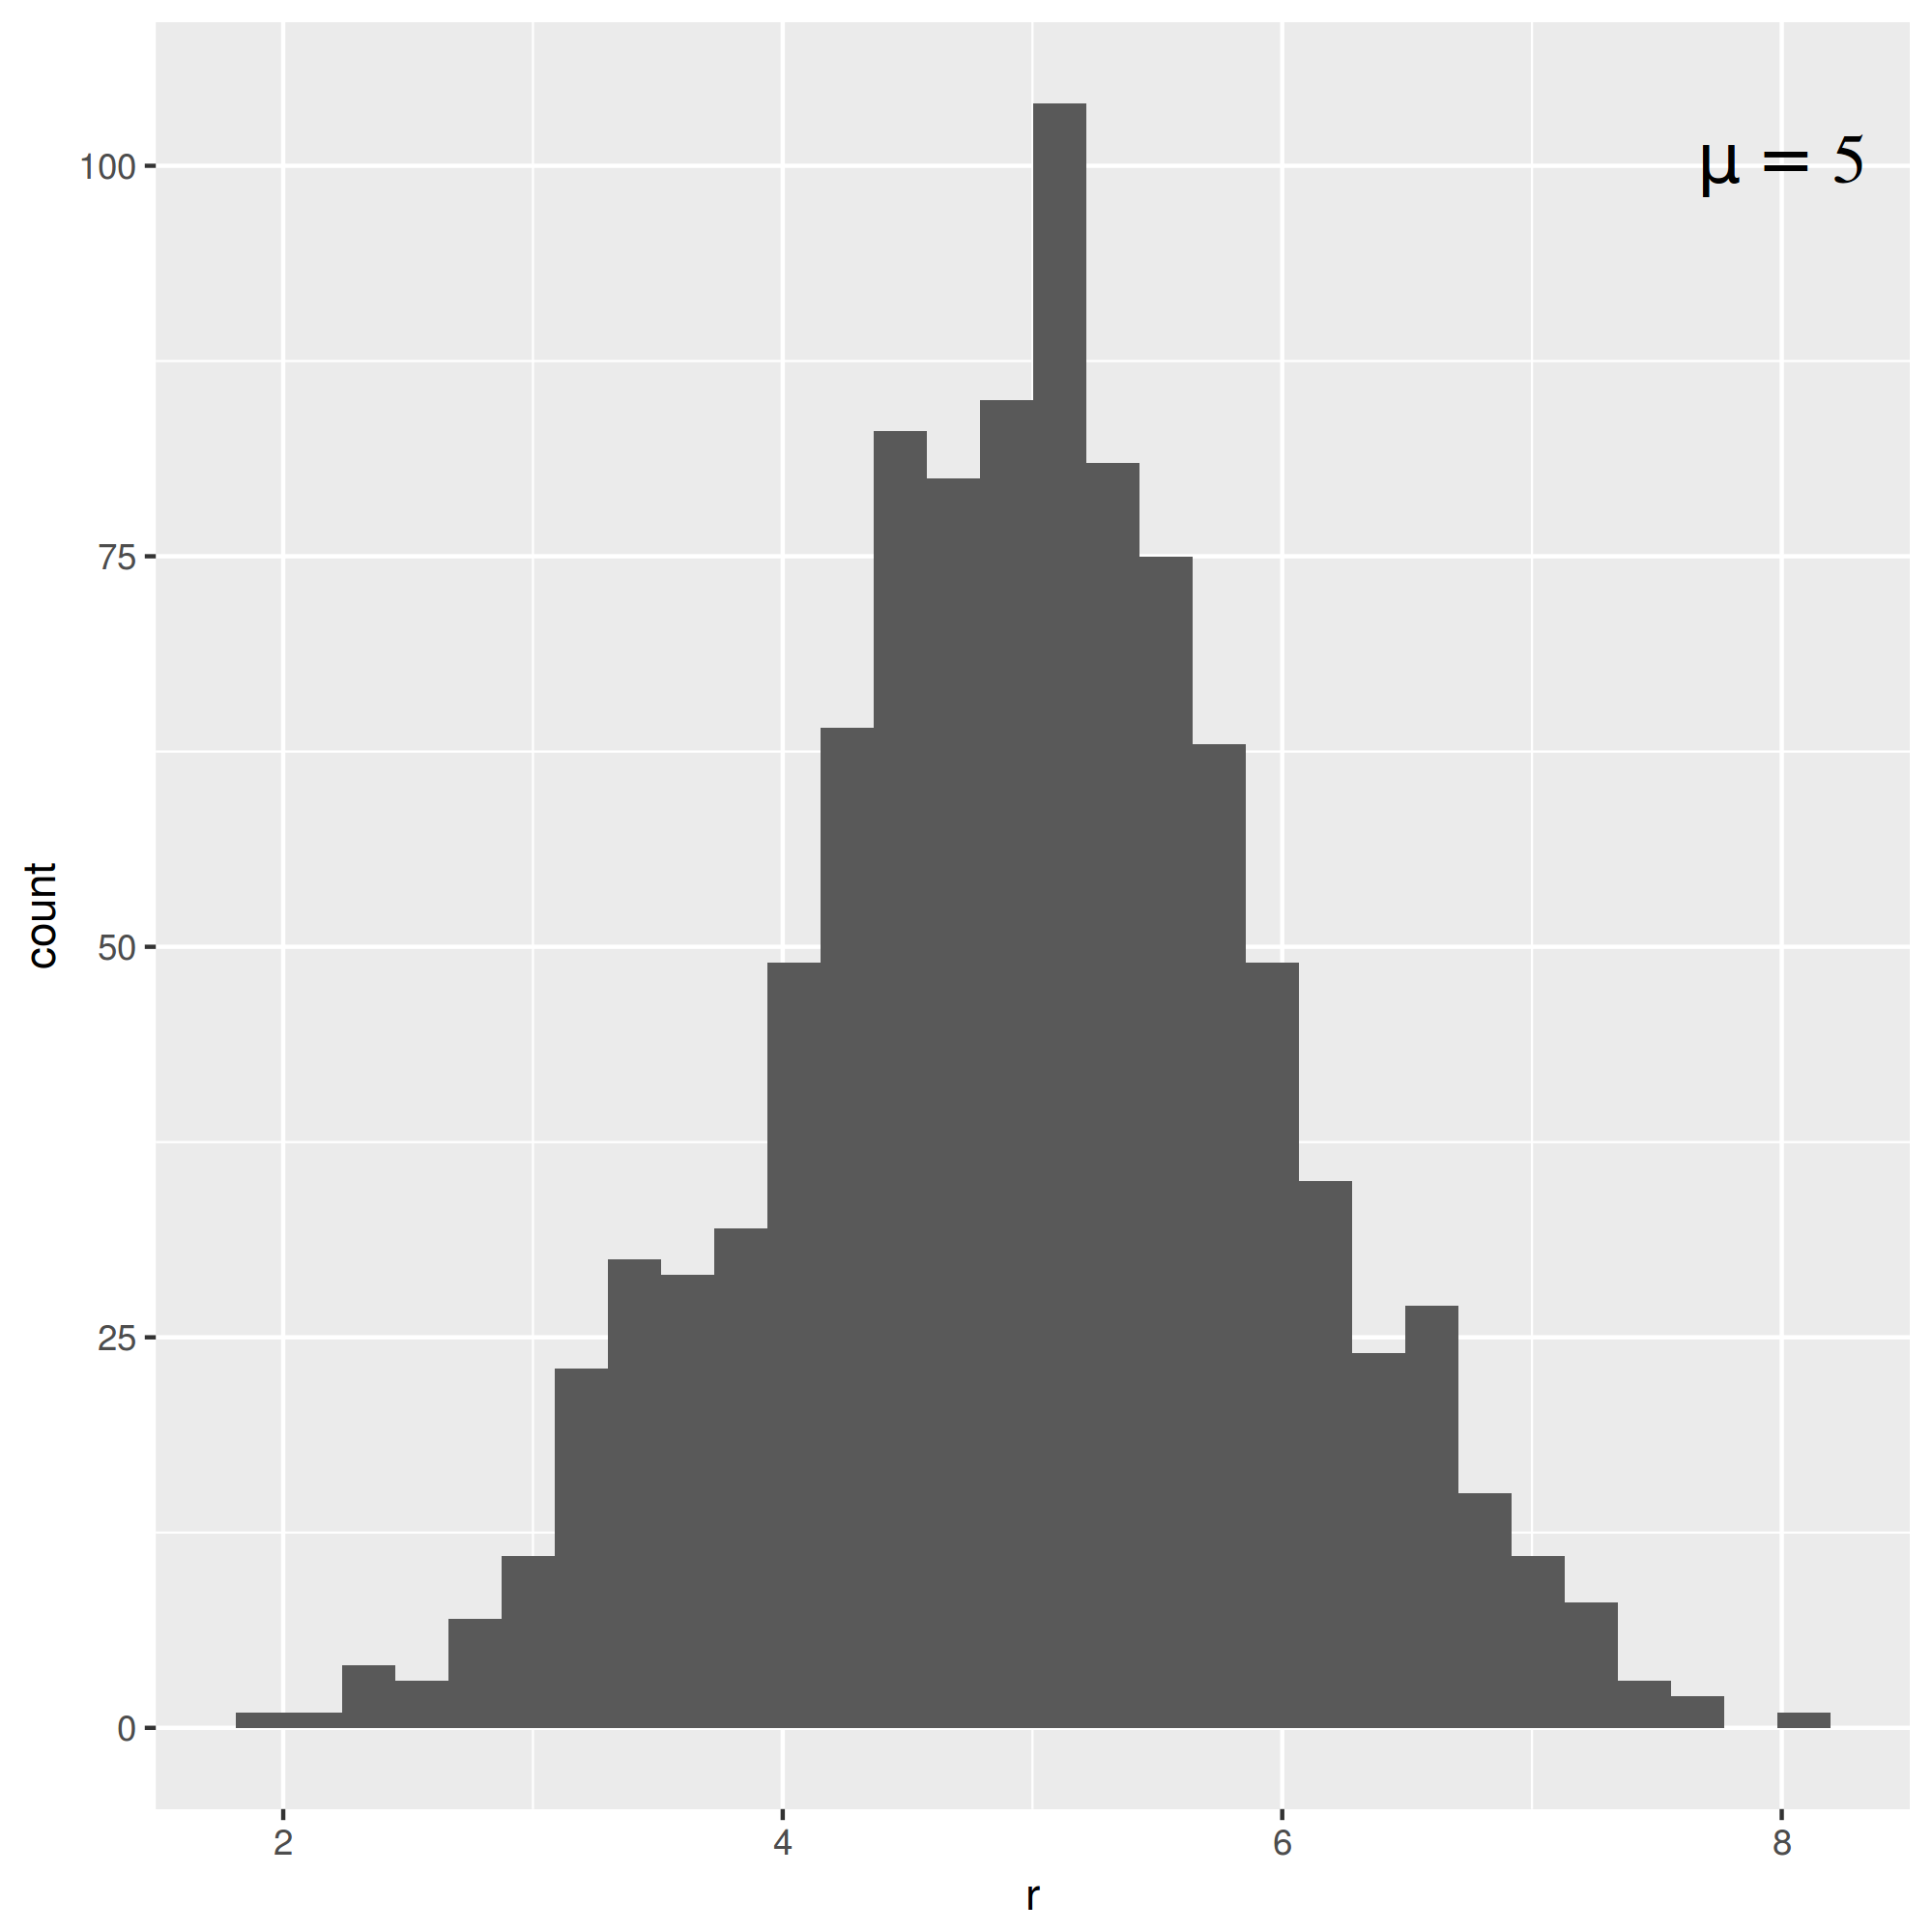
And \(\mu\) is displayed correctly in the default device as shown below.

However, when I tried to save the figure by using pdf("histogram.pdf") or ggsave("histogram.pdf")
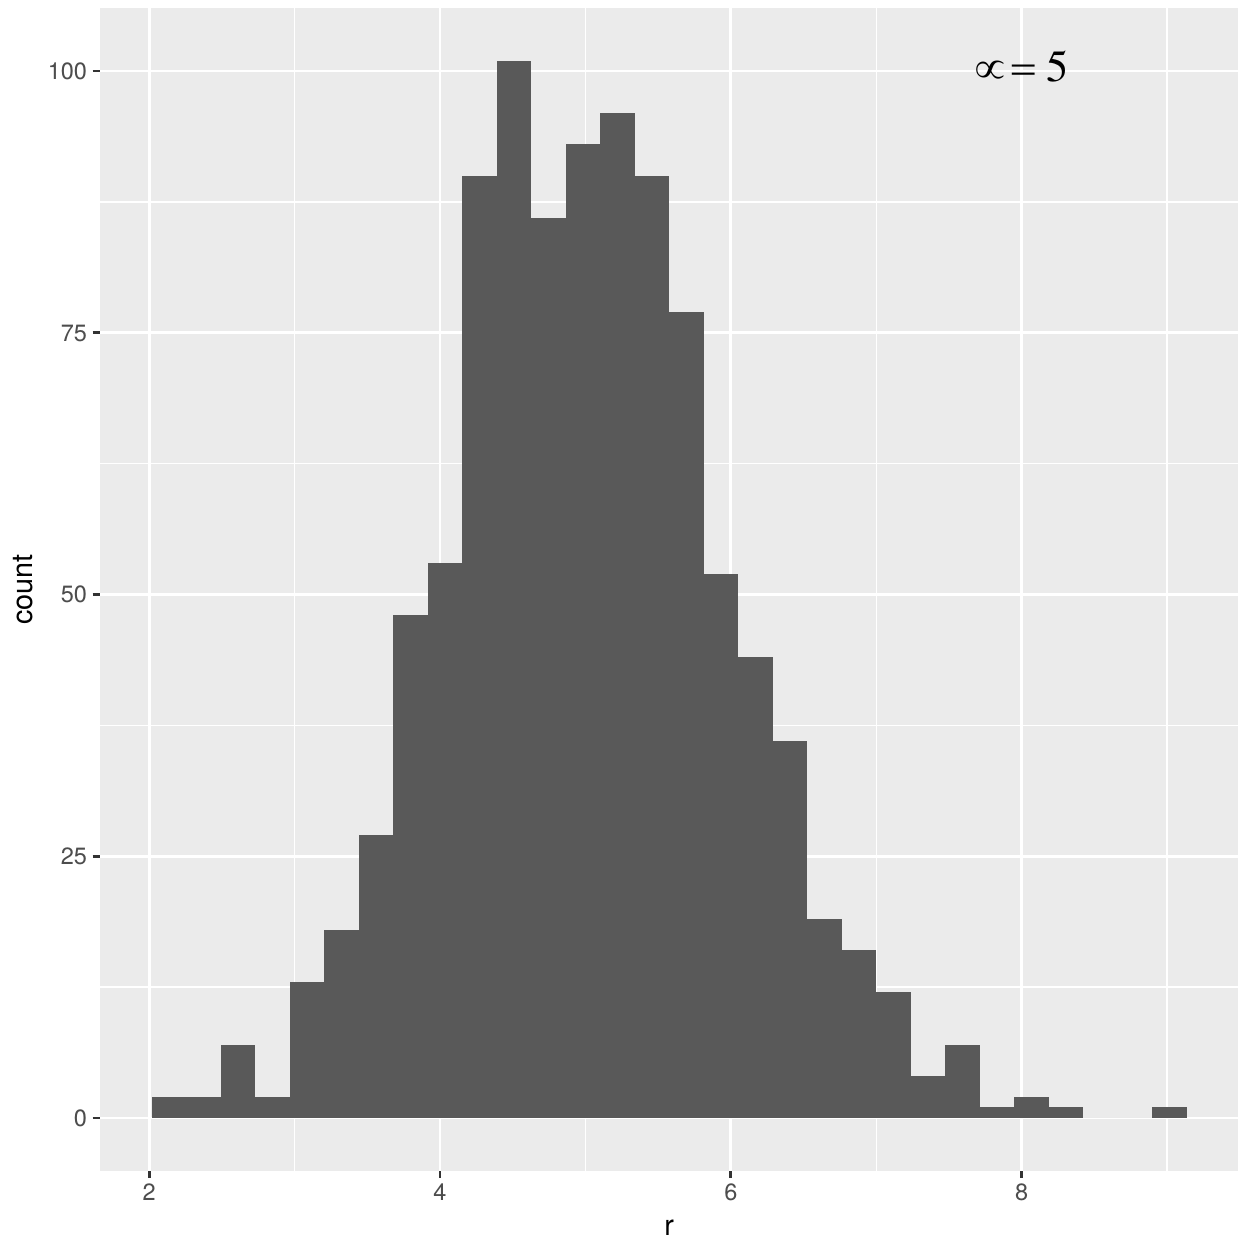
the letter \(\mu\) was displayed as \(\propto\) in the pdf file, as shown below.

This can be fixed by saving the figure to pdf with cairo_pdf("histogram.pdf").
I suspect it was because of encoding or font issue in the saving process.
By the way, if one wants \(\mu\) to be displayed as italic, then changing
lstr1 <- expression(mu == 5) to lstr1 <- expression(italic("\u03BC") == 5)
will do.
Here \u03BC is the unicode of \(\mu\). (cf. Greek letters, symbols, and line breaks inside a ggplot legend label)